Following a Retreating Shore
Inland water bodies are sensitive natural indicators of climate stress and water management decisions. Because open water absorbs solar radiation strongly in the near-infrared spectrum, satellite imagery can accurately trace shoreline shifts over time.
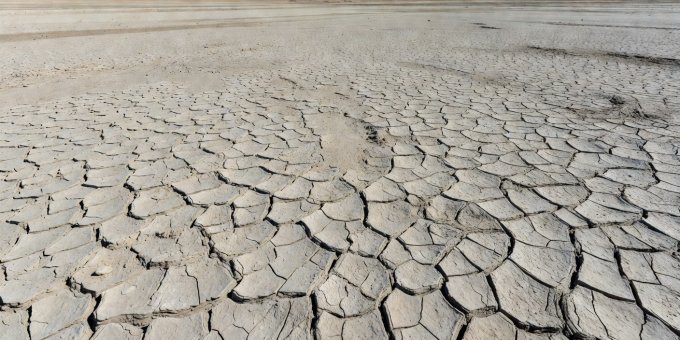
1. The Aral Sea Desiccation: 1960–Present
Once the world's fourth-largest inland sea covering 68,000 square kilometers, the Aral Sea straddles Kazakhstan and Uzbekistan. Starting in the 1960s, Soviet engineers diverted the Amu Darya and Syr Darya rivers to irrigate cotton plantations in the Karakum Desert.
The Landsat archive provides an unbroken satellite timeline of this transition. By 1989, the sea had split into a Northern Small Aral and a Southern Large Aral. In 2014, the southern eastern lobe dried completely for the first time in modern records, creating 54,000 square kilometers of new saline desert known as the Aralkum.
Satellite thermal sensors (such as MODIS on Terra and Aqua) track catastrophic toxic dust storms lifting thousands of tons of salt, pesticide residue, and dried sediments from the exposed bed, transporting them into the atmosphere toward agricultural settlements over 500 kilometers away.
2. Lake Urmia: The Hypersaline Transition
Located in northwestern Iran, Lake Urmia was once one of the largest permanent hypersaline lakes on Earth. Between 1995 and 2015, its surface area plummeted by more than 80%. In this case, satellites captured a curious optical transformation: as water depth dropped and salinity spiked beyond 300 grams per liter, green microalgae (Dunaliella salina) and halophilic bacteria produced carotenoid pigments that turned the entire lake bright blood-red in true-color Sentinel-2 captures.
A hasty observer viewing the satellite frame might announce an unnatural chemical contaminant. Ground-truth water sampling and laboratory spectrophotometry proved the color was a biological response to hyper-salinity, not industrial runoff.
3. Lake Poopó and High-Andean Evaporation
At 3,686 meters above sea level on the Bolivian Altiplano, Lake Poopó had an average depth of only 1.5 to 3 meters. In December 2015, optical satellites observed the lake surface shrink to scattered muddy pools. While regional warming and recurrent El Niño droughts accelerated evaporation, multispectral channel analysis revealed that upstream diversions from the Desaguadero River for tin and silver mining were key contributing factors.
"Shoreline retreat is measurable down to the pixel. Assigning the balance of responsibility between climate trends and human water withdrawals requires linking orbital time series with ground-based flow meters." Hydrological Remote Sensing Protocol, 2025
4. How Satellites Separate Seasonal Swings from Long-Term Loss
Many lakes experience dramatic seasonal expansion during monsoon seasons or spring snowmelts, followed by dry-season contraction. Sceptics sometimes select a wet-season spring image from 1990 and compare it against a dry-season autumn image from 2024 to manufacture an exaggerated retreat narrative.
To produce valid scientific evidence, researchers practice phenological normalization: comparing only imagery acquired during the identical week of the water year, cross-referencing multi-year precipitation indices, and measuring bathymetric depth curves from satellite radar altimetry (such as Sentinel-3 SRAL and Jason-3).