Reading the Changed Landscape
When natural hazards strike, physical roads, cellular towers, and regional power grids are often severed. In these moments, spaceborne observation provides independent, synoptic situational awareness across entire mountain ranges and river basins.
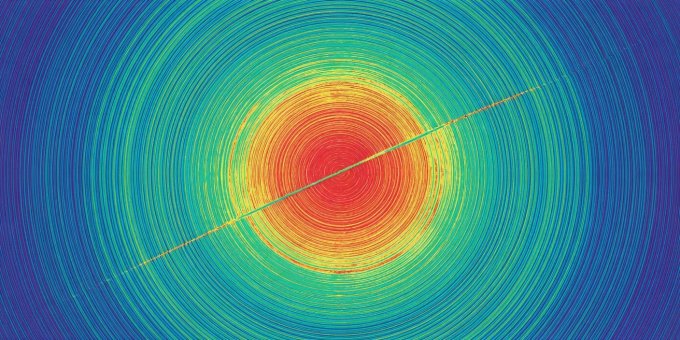
1. InSAR: Measuring Millimeters of Earthquake Displacement
Interferometric Synthetic Aperture Radar (InSAR) compares the phase of two radar signals captured over the identical area days or weeks apart. If the ground moved toward or away from the satellite by even a few millimeters, the wave phase shifts.
When visualized, these phase differences form multicolored rainbow rings called interferometric fringes. Each full color cycle represents ground displacement equal to half the radar wavelength (approximately 2.8 cm for Sentinel-1). Following the 2023 Kahramanmaraş earthquakes in Turkey, InSAR maps precisely traced the 300-kilometer rupture along the East Anatolian Fault, measuring surface offsets exceeding 6 meters.
2. Flood Inundation vs. Specular Radar Reflection
Mapping catastrophic floods is an operational priority under the International Charter on Space and Major Disasters. While optical imagery is blocked by continuous cloud decks and torrential storm fronts, radar signals penetrate clouds easily.
Calm standing water acts like a flat specular mirror for radar waves. The transmitted pulse strikes the lake or submerged plain and bounces away into space, rather than scattering back to the satellite antenna. Consequently, flooded areas appear as distinctive jet-black patches in radar amplitude images.
Radar Ambiguity in Built Environments
Radar flood mapping becomes ambiguous inside cities. Building walls and streets create "double-bounce" reflections that can make flooded streets appear intensely bright instead of dark. Emergency responders must combine radar backscatter with digital surface models and hydrodynamic drainage maps.
3. Volcanic Pre-Eruption Inflation
Long before magma breaches the crater of a stratovolcano, rising molten rock exerts hydraulic pressure on the surrounding rock chambers. Satellites record subtle topographic inflation—the volcanic mountain physically swelling upward like a slow balloon.
By monitoring volcanoes like Iceland's Fagradalsfjall or Hawaii's Kīlauea with satellite altimetry and thermal infrared sensors, volcanologists detect thermal anomalies and ground inflation weeks prior to visible surface fissure openings.
4. Wildfire Burn Severity & Vegetative Regrowth
Optical satellites map fire perimeters by calculating the Normalized Burn Ratio (NBR):
Healthy green vegetation reflects strong NIR and absorbs SWIR, producing high positive NBR values. Charred soil and ash absorb NIR and reflect SWIR, yielding low or negative values. By subtracting post-fire NBR from pre-fire baseline NBR (delta NBR), forestry agencies map soil burn severity categories to target erosion controls and prevent post-fire mudslides.